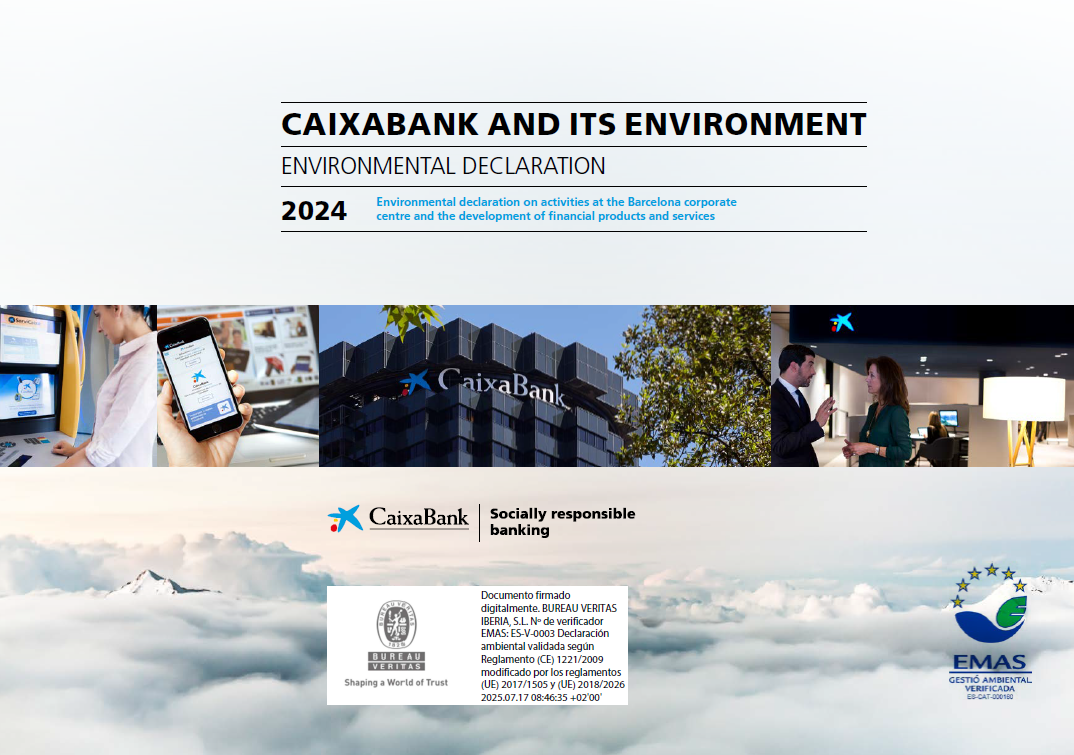
Caixabank (Go to Home)
 Print page
Environmental management
We are committed to protecting the environment in which we operate.
Our environmental and energy practices always seek excellence, in accordance with our Sustainability Principles .
We drive our commitment through the Environmental Management Plan 2025-2027 , which focuses on mitigating the environmental impact of the Group's activities. This plan measures our impact by calculating the carbon footprint and prioritises its reduction through six lines of action:
|
Environmental Management Plan 2025–2027 |
|
|
Lines of action |
Main initiatives |
|
1. Climate change |
Purchase of 100% renewable energy (to distributor +PPA). Implementation of carbon's internal price. |
|
2. Environmentally-friendly procurement and contracting |
Engagement with suppliers to calculate the carbon footprint and reduction targets. Maintenance and extension of the Environmental Plan for Procurement and Contracts. |
|
3. Commitment to circular economy |
ReÚtilizame Project of donations to extend the useful life of materials (IT equipment, furniture, etc.). Project for the reuse of the plastic from obsolete bank cards. |
|
4. Sustainable Mobility Plan |
Reduction of the fleet of corporate vehicles. Extension of the electric vehicle charging points and carsharing vehicles. Awareness actions aimed at reducing emissions associated with corporate travel. |
|
5. Promotion of efficiency |
Energy efficiency measures, such as the installation of home automation systems in branches, the installation of LED lighting, new, more efficient climate control equipment, and other best practices such as timed regulations and setpoint temperature adjustments, among others. Reduction of consumption thanks to the progress of digitisation projects, such as saving paper, toner and bank cards, among others. Analysis to change the documentary management model. |
|
6. Renewal of voluntary certifications and extension of the scope |
Extension of the scope of the ISO 14001 certification. Extension of the events qualified as sustainable. |
In order to meet our reduction target, monitored by the Sustainability Committee, we have adopted our own strategy tailored to the operational needs. This strategy's approach enables us to manage our own emissions and is aligned with the impacts identified in the Double Materiality Study.
The targets set by 2030 are the following:
|
Action plans |
Targets2 |
2025 |
2026 |
2027 |
2030 |
||||
|---|---|---|---|---|---|---|---|---|---|
|
|
|
CaixaBank S.A. |
CaixaBank Group |
CaixaBank S.A. |
CaixaBank Group |
CaixaBank S.A. |
CaixaBank Group |
CaixaBank S.A. |
CaixaBank Group |
|
Carbon footprint mitigation strategy
|
Reduction of Scope 1 Emissions (Tn CO2) |
-9% |
-4% |
-12% |
-6% |
-16% |
-7% |
-22% |
-10% |
|
Scope 2 Emissions (Market Method) (Tn CO2) |
0 |
0 |
0 |
0 |
0 |
0 |
0 |
0 |
|
|
Reduction of Scope 1+2 Emissions (Location Method) (Tn CO2) |
-5% |
-4% |
-8% |
-6% |
-10% |
-7.5% |
-15% |
-11% |
|
|
Reduction of Scope 1+2 Emissions (Market Method) (Tn CO2) |
-9% |
-4% |
-12% |
-6% |
-16% |
-7% |
-22% |
-10% |
|
|
Reduction of Scope 1+2 Emissions (Location Method) (Tn CO2) |
-6% |
-4% |
-9% |
-6% |
-11% |
-7.5% |
-16% |
-11% |
|
|
Carbon footprint offsetting - Scopes 1, 2 and 3.6 (corporte travel) |
100% |
100% |
100% |
100% |
100% |
100% |
100% |
100% |
|
|
Renewable energy consumption (kWh) |
100% |
100% |
100% |
100% |
100% |
100% |
100% |
100% |
|
|
Fostering efficiency |
Saving in electricity consumption (kWh) |
-5% |
-4% |
-8% |
-6% |
-10% |
-7.5% |
-15% |
-11% |
CaixaBank has set emission reduction targets for Scope 1 and 2, following the same perimeter as the one reported for these scopes in the Group's Operational Carbon Footprint. Therefore, 100% of the Scope 1 and 2 emissions are covered by the decarbonisation targets. For the base year 2024, Scope 1 and Scope 1+2 emissions from CaixaBank, S.A. accounted for 1.3% of the company’s total emissions in that year, while for the CaixaBank Group they accounted for 1.8% of the Group’s emissions in that same year, with Scope 2 emissions being 0% in both cases.
In 2025, the first year of implementation of the current Environmental Management Plan, we have achieved the objectives set by the Group. This has been possible thanks to the measures implemented throughout 2025 and the actions carried out in recent years:
- For calculating the Scope 1 target, refrigerant gas emission data use as a baseline the average for the 2022–2024 period.
- To assess the degree of achievement of the Scope 1 reduction targets, emissions associated with fuel consumption for electricity generation during the power outage recorded in Spain and Portugal at the end of April 2025 (108.44 TnCO₂) have been excluded.
- For calculating compliance with the energy and Scope 2 emissions reduction target (Location Method), normalized consumption data for CaixaBank, S.A. have been considered. These data take into account outdoor temperature values and have been calculated following the methodology established by the international IPMVP protocol.
- Despite meeting the objectives related to reducing electricity consumption, the desired values for Scope 2 emissions calculated using the Location Method have not been achieved. This is exclusively due to the increase in the emission factor of the Spanish electricity mix used to calculate these emissions—a factor over which CaixaBank has no direct influence.
Management of climate change
Financial institutions have a key role to play in achieving the Paris Agreement and the Sustainable Development Goals (SDGs). With this in mind, at CaixaBank we approved the Statement on Climate Change in February 2019, updated in July 2025, the aim of which is to contribute to the transition towards a low-carbon and socially-just economy, as well as to promote sustainable development and economic growth.
One of the main lines of action of the Statement on Climate Change is to reduce our activity's CO2 emissions and offset those emissions that cannot be avoided in accordance with our carbon neutral plan.
Carbon Neutral Strategy
Our strategy to achieve emission neutrality is based on measuring, reducing, and offsetting those emissions we cannot avoid

01. Calculation of our operational carbon footprint

![]()
02. Reduction of CO2 emissions

03. Offsetting of unavoidable emissions
01. Calculation of the operational carbon footprint
At CaixaBank, S.A. we conduct an annual inventory of the greenhouse emissions (GHG) generated as a result of our corporate activity to calculate the carbon footprint and establish actions aimed at gradually reducing it.
In 2025, the Group performed a materiality analysis with the goal of determining the relevance of indirect GHG emissions categories (Scope 3), in order to determine the operational limits to be included in the Group's carbon footprint in the forthcoming years. The scope of the materiality analysis comprised 19 Group companies representing 99.8% of CaixaBank Group employees. The analysis shows that the sole relevant category in this scope, with a weight of 99.5% of total Scope 3 emissions, is category 3.15, which corresponds to financed emissions.
However, the following categories were also defined as material, taking into account both their associated emissions volume and the possibilities to influence their control and reduction.
- 3.1 Purchased goods and services
- 3.2 Purchased capital goods
- 3.3 Fuel and energy-related activities
- 3.6 Corporate travel
- 3.7 Employee commuting to their workplaces
On the basis of the conclusions of the materiality analysis, a new perimeter was defined for calculating the operational carbon footprint that includes all the emissions of the categories defined as material for the entire Group. The results of this calculation are presented in the following table:
CaixaBank Group operational carbon footprint (TCO2EQ)
| Item |
Source |
CaixaBank S.A. | Grupo CaixaBank | ||
|---|---|---|---|---|---|
| Scope 1 | Combustion in fixed sources | Boilers or emergency equipment | Gas oil C | 216.21 | 367.89 |
| Natural gas | 625.04 | 634.03 | |||
| Propane gas | 9.39 | 9.39 | |||
| Combustion in mobile sources | Rental vehicles | 54.09 | 3,363.10 | ||
| Cooling gas leaks | Cooling gases | 2,878.15 | 3,271.82 | ||
| Scope 2 | Market-based method | 0.00 | 0.00 | ||
| Location-based method | 16,843.56 | 23,101.00 | |||
| Electricity self-consumption | 0.00 | 0.00 | |||
| Scope 3 | 3.1 Purchase of goods and services | OPEX | 168,460.55 | 278,800.91 | |
| 3.2 Capital goods | CAPEX | 48,029.58 | 73,286.95 | ||
| 3.3 Fuel and activities | Electricity and fuel value chain and transmission |
2,454.50 | 4,135.99 | ||
| 3.6 Travel | Aeroplane, train, cars and hotels | 11,770.02 | 14,418.43 | ||
| 3.7 Commute in itinere | Various modes of transport | 50,659.13 | 57,360.18 | ||
| Total (Current Perimeter) | Scope 1 | 3,782.88 | 7,646.23 | ||
| Scope 2 (Market-based) |
0.00 | 0.00 | |||
| Scope 2 (Location-based) | 16,843.56 | 23,101.00 | |||
| Scope 3 | 281,373.78 | 428,002.46 | |||
| Total (Market-based) | 285,156.66 | 435,648.69 | |||
| Total (Location-based) | 302,000.22 | 458,749.69 | |||
| Total per employee (Market-based) | 7.65 | 9.36 | |||
CaixaBank Group operational carbon footprint (TCO2EQ)
| Item |
Source |
CaixaBank S.A. | Grupo CaixaBank | ||
|---|---|---|---|---|---|
| Scope 1 | Combustion in fixed sources | Boilers or emergency equipment | Gas oil C | 218.86 | 346.63 |
| Natural gas | 346.63 | 612.89 | |||
| Propane gas | 2.54 | 2.54 | |||
| Combustion in mobile sources | Rental vehicles | 210.78 | 3,619.06 | ||
| Cooling gas leaks | Cooling gases | 2,158.96 | 2,511.85 | ||
| Scope 2 | Market-based method | 0.00 | 0.00 | ||
| Location-based method | 16,395.42 | 23,046.75 | |||
| Electricity self-consumption | 0.00 | 0.00 | |||
| Scope 3 | 3.1 Purchase of goods and services | OPEX | 122,756.03 | 236,247.88 | |
| 3.2 Capital goods | CAPEX | 52,424.44 | 72,699.59 | ||
| 3.3 Fuel and activities | Electricity and fuel value chain and transmission |
3,177.78 | 5,117.53 | ||
| 3.6 Travel | Aeroplane, train, cars and hotels | 12.137,08 | 15.055,20 | ||
| 3.7 Travel in itinere | Various modes of transport | 48,597.15 | 54,694.88 | ||
| Total (Current Perimeter) | Scope 1 | 3,192.90 | 3,192.90 | ||
| Scope 2 (Market-based) |
0.00 | 0.00 | |||
| Scope 2 (Location-based) | 16,395.42 | 23,046.75 | |||
| Scope 3 | 239,092.48 | 383,815.07 | |||
| Total (Market-based) | 242,285.39 | 390,908.05 | |||
| Total (Location-based) | 258,680.81 | 413,954.80 | |||
| Total per employee (Market-based) | 6.63 | 8.65 | |||
CaixaBank Group operational carbon footprint (TCO2EQ)
| Item | Source | CaixaBank S.A. |
CaixaBank Group |
||
|---|---|---|---|---|---|
| Scope 1 | Combustion in fixed sources | Boilers or emergency equipment | Gas oil C | 290.82 | 467.92 |
| Natural gas | 621.62 | 654.55 | |||
| Propane gas | 3.56 | 3.56 | |||
| Combustion in mobile sources | Rental vehicles | 395.90 | 3,858.33 | ||
| Cooling gas leaks | Cooling gases | 3,376.72 | 3,438.98 | ||
| Scope 2 | Market-based method | — | — | ||
| Location-based method | 21,082.12 | 29,383.94 | |||
| Electricity self-consumption | — | — | |||
| Scope 3 | 3.1 Purchase of goods and services | OPEX | 63,566.73 | 158,000.89 | |
| 3.2 Capital goods | CAPEX | 43,338.53 | 46,755.71 | ||
| 3.3 Fuel and activities | Electricity and fuel value chain and transmission |
3,996.56 | 6,142.58 | ||
| 3.6 Travel | Aeroplane, train, cars and hotels | 9,006.43 | 10,964.72 | ||
| Total (Current Perimeter) | Scope 1 | 4,688.62 | 8,423.34 | ||
| Scope 2 (Market-based) |
— | — | |||
| Scope 2 (Location-based) | 21,082.12 | 29,383.94 | |||
| Scope 3 | 119,908.25 | 221,863.91 | |||
| Total (Market-based) | 124,596.86 | 230,287.25 | |||
| Total (Location-based) | 145,678.98 | 259,671.20 | |||
| Total per employee (Market-based) | 3.45 | 5.18 | |||
| Scope 3 (Former Perimeter)1 |
3.1 Purchase of goods and services | Mains water | 162.38 | 162.38 | |
| A4 paper | 1,649.59 | 1,649.59 | |||
| Other paper | 2,346.78 | 2,346.78 | |||
| Other goods (toner, vinyl and cards) | 575.03 | 575.03 | |||
| 3.2 Capital goods | Towers, laptops, monitors and keyboards | 979.45 | 979.45 | ||
| 3.3 Fuel and activities | Value chain and transmission of nonrenewable electricity | 0.00 | 0.00 | ||
| 3.4 Waste generation | Toner and IT support | 1,436.76 | 1,436.76 | ||
| 3.5 Corporate travel | Aeroplane, train, cars | 8,826.88 | 8,826.88 | ||
| Total (Former Perimeter) | Scope 1 | 4,688.62 | 8,423.34 | ||
| Scope 2 (Market-based) | — | — | |||
| Scope 2 (Location-based) | 21,082.12 | 29,383.94 | |||
| Scope 3 | 15,976.88 | 15,976.88 | |||
| Total (Market-based) | 20,665.49 | 24,400.22 | |||
| Total (Location-based) | 41,747.61 | 53,784.16 | |||
| Total per employee (Market-based) | 0.57 | 0.55 | |||
CaixaBank Group operational carbon footprint (TCO2EQ)
| Item | Source | CaixaBank S.A. | CaixaBank Group | ||
|---|---|---|---|---|---|
| Scope 1 | Combustion in fixed sources | Boilers or emergency equipment | Gas oil C | 326.46 | 415.48 |
| Natural gas | 791.13 | 892.75 | |||
| Propane gas | |||||
| Combustion in mobile sources | Rental vehicles | 960.40 | 4,161.52 | ||
| Cooling gas leaks | Cooling gases | 3,548.13 | 4,106.54 | ||
| Scope 2 | Market-based method | — | — | ||
| Location-based method | 31,994.66 | 42,670.71 | |||
| Electricity self-consumption | — | — | |||
| Scope 3 | 3.1 Purchase of goods and services | OPEX | 51,980.66 | 128,005.67 | |
| 3.2 Capital goods | CAPEX | 50,164.90 | 60,810.78 | ||
| 3.3 Fuel and activities | Electricity and fuel value chain and transmission | 4,584.67 | 6,715.65 | ||
| 3.6 Travel | Aeroplane, train, cars and hotels | 5,809.91 | 6,794.80 | ||
| Total (Current Perimeter) | Scope 1 | 5,626.12 | 9,576.29 | ||
| Scope 2 (Market-based) |
— | — | |||
| Scope 2 (Location-based) | 31,994.66 | 42,670.71 | |||
| Scope 3 | 112,540.14 | 202,326.90 | |||
| Total (Market-based) | 118,166.26 | 211,903.19 | |||
| Total (Location-based) | 150,160.92 | 254,573.90 | |||
| Total per employee (Market-based) | 3.22 | 4.80 | |||
| Scope 3 (Former Perimeter)1 |
3.1 Purchase of goods and services | Mains water | 153.31 | 153.31 | |
| A4 paper | 2,054.94 | 2,054.94 | |||
| Other paper | 3,489.20 | 3,489.20 | |||
| Other goods (toner, vinyl and cards) | 647.63 | 647.63 | |||
| 3.2 Capital goods | Towers, laptops, monitors and keyboards | 1,440.47 | 1,440.47 | ||
| 3.3 Fuel and activities | Value chain and transmission of nonrenewable electricity | — | — | ||
| 3.4 Waste generation | Toner and IT support | 1,783.20 | 1,783.20 | ||
| 3.5 Corporate travel | Aeroplane, train, cars | 5,689.98 | 5,689.98 | ||
| Total (Former Perimeter) | Scope 1 | 5,626.12 | 9,576.29 | ||
| Scope 2 (Market-based) | — | — | |||
| Scope 2 (Location-based) | 31,994.66 | 42,670.71 | |||
| Scope 3 | 15,258.72 | 15,258.72 | |||
| Total (Market-based) | 20,884.84 | 24,835.02 | |||
| Total (Location-based) | 52,879.50 | 67,505.72 | |||
| Total per employee (Market-based) | 0.57 | 0.56 | |||
CaixaBank Group operational carbon footprint (TCO2EQ)
| Item | Source | CaixaBank S.A. | CaixaBank Group | ||
|---|---|---|---|---|---|
| Scope 1 | Combustion in fixed sources | Boilers or emergency equipment | Gas oil C | 682.61 | 817.43 |
| Natural gas | 970.07 | 1,017.72 | |||
| Propane gas | |||||
| Combustion in mobile sources | Rental vehicles | 1,291.95 | 4,096.07 | ||
| Cooling gas leaks | Cooling gases | 2,818.00 | 3,326.17 | ||
| Scope 2 | Market-based method | 374.17 | 1,153.55 | ||
| Location-based method | 32,784.12 | 43,978.80 | |||
| Electricity self-consumption | — | — | |||
| Scope 3 | 3.1 Purchase of goods and services | OPEX | 59,185.22 | 146,723.85 | |
| 3.2 Capital goods | CAPEX | 36,448.54 | 45,841.97 | ||
| 3.3 Fuel and activities | Electricity and fuel value chain and transmission | 6,358.27 | 8,829.47 | ||
| 3.6 Travel | Aeroplane, train, cars and hotels | 4,473.40 | 5,038.83 | ||
| Total (Current Perimeter) | Scope 1 | 5,762.63 | 9,257.38 | ||
| Scope 2 (Market-based) | 374.17 | 1,153.55 | |||
| Scope 2 (Location-based) | 32,784.12 | 43,978.80 | |||
| Scope 3 | 106,465.44 | 206,434.11 | |||
| Total (Market-based) | 112,602.24 | 216,845.05 | |||
| Total (Location-based) | 145,012.20 | 259,670.30 | |||
| Total per employee (Market-based) | 2.64 | 4.37 | |||
| Scope 3 (Former Perimeter)1 |
3.1 Purchase of goods and services | Mains water | 195.14 | 195.14 | |
| A4 paper | 3,105.14 | 3,105.14 | |||
| Other paper | 4,126.67 | 4,126.67 | |||
| Other goods (toner, vinyl and cards) | 824.34 | 824.34 | |||
| 3.2 Capital goods | Towers, laptops, monitors and keyboards | 3,946.41 | 3,946.41 | ||
| 3.3 Fuel and activities | Value chain and transmission of nonrenewable electricity | 122.64 | 122.64 | ||
| 3.4 Waste generation | Toner and IT support | 1,359.62 | 1,359.62 | ||
| 3.5 Corporate travel | Aeroplane, train, cars | 4,094.93 | 4,094.93 | ||
| Total (Former Perimeter) | Scope 1 | 5,762.63 | 9,257.38 | ||
| Scope 2 (Market-based) | 374.17 | 1,153.55 | |||
| Scope 2 (Location-based) | 32,784.12 | 43,978.80 | |||
| Scope 3 | 17,774.90 | 17,774.90 | |||
| Total (Market-based) | 23,911.70 | 28,185.83 | |||
| Total (Location-based) | 56,321.65 | 71,011.08 | |||
| Total per employee (Market-based) | 0.56 | 0.57 | |||
One of the milestones reached is the certification through Guarantees of Renewable Origin of all the energy consumed by the Group, thus meeting the ZERO EMISSIONS target in Scope 2.
At the CaixaBank Group we have reduced our carbon footprint (Scopes 1 and 2) by 26% since 2021.
We calculate our carbon footprint according to the "The Greenhouse Gas Protocol" and "Corporate Value Chain (Scope 3) accounting and reporting standard". The data are verified annually in the context of the Management Report of the CaixaBank Group.
CaixaBank Carbon Footprint Executive Report 2025
02. Reductions of CO2 emissions
With the aim of helping to reduce the Group's Carbon Footprint emissions, several initiatives have been implemented along the following lines:


03. Offsetting CO2 emissions
Since 2018, CaixaBank offsets all of the CO2 emissions from its activities. This means the offsetting objective includes the emissions associated with corporate centres and the entire branch network, which is the largest in the financial sector in Spain. We currently offset our emissions from Scope 1, 2 and 3.6 (corporate travel) at the CaixaBank Group scale.
In 2024, a qualitative leap was carried out regarding the offsetting of these emissions, since 100% of the offset projects focused on GHG emissions removal, compared to previous years when both emission reduction and removal projects were considered. The projects chosen to offset 2024 emissions were:
- 50% of the tonnes were offset through forest reforestation projects in the municipalities of Esteban de Gormaz and Beratón in Soria, and in Agavanzal in Zamora, verified under the MITECO Verification Standard. Vintage 2024 and 2025.
- 50% of the tonnes were offset through the Forest Project in Montes del Este, located in Uruguay, verified under the VCS (Verified Carbon Standard). Vintage 2020+.
Additionally, among the projects funded through carbon credits, CaixaBank has two of its own CO2 absorption projects, which consist of reforesting areas burned by fire in the Montserrat mountains in Barcelona and in the town of Ejulve in Teruel, which it has promoted, financed and managed.
Both projects are included in the Register of carbon footprints, offsetting and carbon dioxide absorption projects validated by MITECO. To manage the permanence risk, the Ministry reserves a portion of the absorptions allocated to the guarantee fund. The emissions absorbed by this forest were calculated following the methodology established by the Climate Change Office of MITECO.
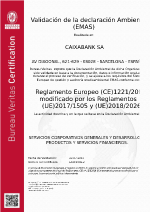
Membership and Certifications
We register our carbon footprint with the Ministry for the Ecological Transition and the Demographic Challenge's Register of carbon footprints, offsetting and carbon dioxide absorption projects, and we have signed up to the Voluntary Agreements Programme for the reduction of greenhouse gas (GHG) emissions run by the Catalan Office for Climate Change (OCCC).
Register of carbon footprints (MTE)
![]()
Voluntary Agreements Programme of Generalitat de Catalunya
Environmental and energy management system
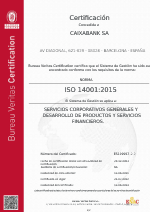
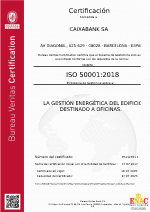
At CaixaBank, we have implemented an environmental and energy management system as a tool to structure our management and reduce the environmental impact of our activities, ensuring a process of continuous improvement.
CaixaBank S.A. has 6 buildings certified under ISO 14001, 2 buildings certified under ISO 50001, and 1 building certified under the EMAS Regulation, as well as the Environmental Quality Seal in all branch offices across Catalonia. This means that 30% of employees work in spaces that hold some type of environmental certification, and that 71% of those working in headquarters do so in buildings certified under ISO 14001.


ENVIRONMENTAL AND ENERGY MANAGEMENT SYSTEM
CONTEXT
- Internal and external context
- Expectations of stakeholders

Plan
Establish processes and objectives

Act
Take steps for
on-going
improvement

Do
Implement processes

Verify
Assess performance
ENVISAGED RESULTS
CONTEXT
- Internal and external context
- Expectations of stakeholders
ENVISAGED RESULTS
Plan
Establish processes and objectives
Act
Take steps for
on-going
improvement
ENVIRONMENTAL AND ENERGY MANAGEMENT SYSTEM
Do
Implement processes
Verify
Assess performance

Principles
Sustainability Principles
Declaration on climate change

External certifications
EMAS regulation
ISO 14001
ISO 50001

Supervision
Enviromental Risk Management Committee
Corporate Responsibility and Reputation Committee